PWD IntelligenceThe Active ETF ReportWeek of Nov 9
Active ETF net flows, the week
$1B
up $809.9MChange vs the prior week
Source for Active ETF net flows, the week
Source: Amplify ETFs, Avantis Investors, Capital Group, NEOS Investments, YieldMax ETFs, iShares (BlackRock) published daily NAV and shares outstanding; flow = change in shares outstanding x NAVActive ETFs at six issuers take in $1.02 billion in a week
Active funds drew 5.9% of gross ETF inflows at the six issuers in the week to Nov. 11, below the 7.1% of assets they hold.
Share
By PWD Intelligence8 min read
Index ETF net flows, the week
$8.1B
472 index funds
Source for Index ETF net flows, the week
Source: Amplify ETFs, Avantis Investors, Capital Group, NEOS Investments, YieldMax ETFs, iShares (BlackRock) published daily NAV and shares outstanding; flow = change in shares outstanding x NAVActive share of new money
5.9%
Against 7.1% of covered assets
Source for Active share of new money
Source: Amplify ETFs, Avantis Investors, Capital Group, NEOS Investments, YieldMax ETFs, iShares (BlackRock) published daily NAV and shares outstanding; flow = change in shares outstanding x NAVActive launches, eight weeks
19
8.2% of all ETF launches
Source for Active launches, eight weeks
Source: SEC EDGAR effectiveness filings (485BPOS) and issuer fund records (inception date); style Active where the fund's SEC Form N-CEN record, else the issuer's own record, else its registered name says so; leveraged, inverse and single-stock daily funds are counted with index fundsActive funds covered
114
6 issuers: Amplify ETFs, Avantis Investors, Capital Group, NEOS Investments, YieldMax ETFs, iShares (BlackRock)
Source for Active funds covered
Source: Amplify ETFs, Avantis Investors, Capital Group, NEOS Investments, YieldMax ETFs, iShares (BlackRock) published daily NAV and shares outstanding; flow = change in shares outstanding x NAV; active ETF universe from our fund records and SEC Form N-CEN Item C.19 monthly average net assetsWhat matters
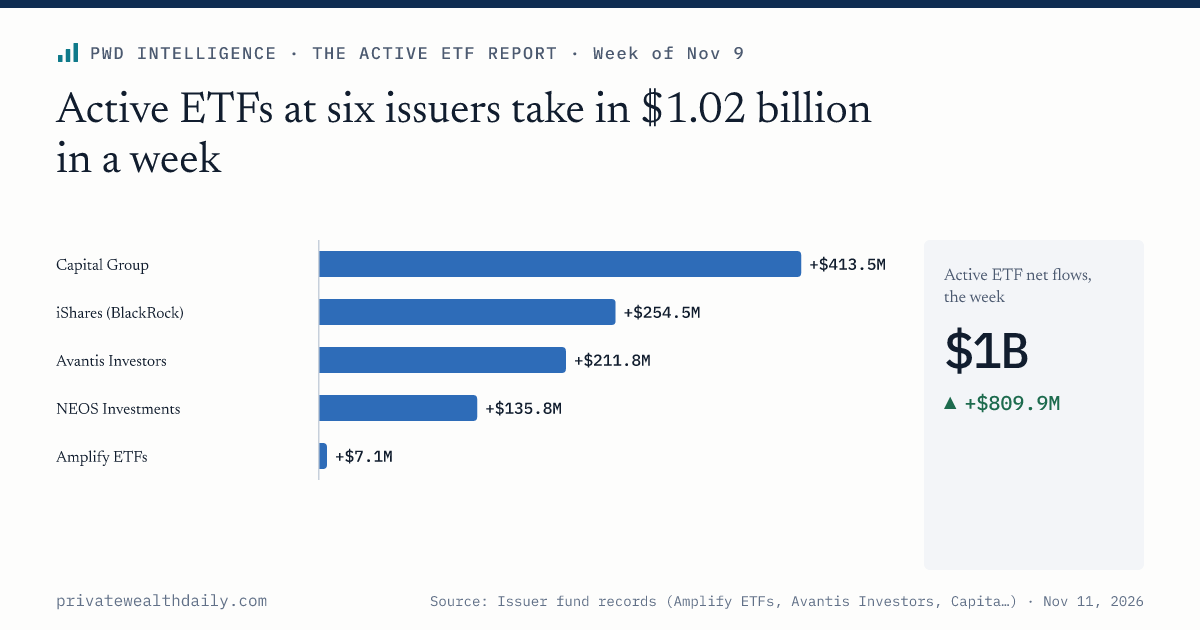
- Active ETFs at the six covered issuers took in a net $1.02 billion in the week to Nov 11, up from $212.9 million the prior week, according to issuer fund records.
- Capital Group's 24 active ETFs took in a net $413.5 million, 41.2% of active gross inflows, after $0 in each of the three prior weeks, according to Capital Group's published daily fund data.
- Active funds took 5.9% of gross ETF inflows at the covered issuers in the week to Nov 11 against 7.1% of covered assets, according to issuer fund records.
Chart 1
Net flows into active ETFs by issuer, week to Nov 11
Inflows above zero, outflows below; issuer-reported funds only
- Above zero
- Below zero
- Capital Group+$413.5M
- iShares (BlackRock)+$254.5M
- Avantis Investors+$211.8M
- NEOS Investments+$135.8M
- Amplify ETFs+$7.1M
Show as table
| Label | Value ($) |
|---|---|
| Capital Group | +$413.5M |
| iShares (BlackRock) | +$254.5M |
| Avantis Investors | +$211.8M |
| NEOS Investments | +$135.8M |
| Amplify ETFs | +$7.1M |
Active ETFs took $1.02 billion, but earlier weeks cover iShares only
Active ETFs at six issuers took in a net $1.02 billion in the week to Nov. 11, according to the issuers' published daily fund data. The six are Amplify ETFs, Avantis Investors, Capital Group, NEOS Investments, YieldMax ETFs and iShares (BlackRock).
Active inflows rose from $212.9 million the prior week, but the comparison is not like-for-like because five of the six issuers show $0 in each of the three prior weeks. Those earlier totals reflect iShares flows alone. On iShares alone, net flow was $254.5 million this week against $212.9 million the week before.
For advisors gauging active ETF demand, the $1.02 billion covers six issuers whose 114 active funds hold 20.6% of active ETF assets reported in SEC Form N-CEN filings. Those funds hold $343.9 billion: 27 at Avantis, 24 at Capital Group, 21 at iShares, 19 at YieldMax, 16 at NEOS and seven at Amplify. The figures are not a market-wide active ETF flow total.
Active funds drew 5.9% of gross ETF inflows at the six issuers against 7.1% of their assets, so on this measure they did not gain ground. Index funds took a net $8.14 billion, down from $14.20 billion the prior week, and $17.02 billion of gross inflows against active's $1.06 billion. Leveraged, inverse and single-stock daily funds count as index funds in that comparison. Active's shares of 1.1%, 1.8% and 1.0% in the earlier weeks carry the same caveat about which issuers recorded flows.
Chart 2
Net flows into active ETFs by week
Weeks ending on the date shown
- Inflow / above zero
- Outflow / below zero
Show as table
| Label | Value ($) |
|---|---|
| Oct 21 | $276.1M |
| Oct 28 | $303.9M |
| Nov 4 | $212.9M |
| Nov 11 | $1B |
Four weeks of net flows across every covered active fund.
DYNF led the inflows and five funds took 55% of the money
The BlackRock US Equity Factor Rotation ETF (DYNF) took the week's largest active inflow, $232.4 million, according to iShares' published daily fund data. It is the only fund among the leaders with money in all four weeks: $259.1 million, $291.3 million, $195.8 million and $232.4 million. This week's inflow equals 0.56% of its $41.6 billion in assets as of Nov. 10.
Capital Group Growth ETF (CGGR) followed at $117.0 million and Avantis U.S. Large Cap Value ETF (AVLV) at $90.1 million. Capital Group Dividend Value ETF (CGDV) added $73.6 million, NEOS Nasdaq 100 High Income ETF (QQQI) $70.3 million and NEOS S&P 500 High Income ETF (SPYI) $65.8 million. DYNF, CGGR, AVLV, CGDV and QQQI together took 55% of active gross inflows.
Capital Group Conservative Equity ETF (CGCV) took $39.9 million, 1.62% of its $2.46 billion in assets, the highest flow-to-asset ratio among the 10 largest inflows, according to Capital Group's published data.
Outflows were small. Capital Group International Equity ETF (CGIE) lost $21.9 million, 0.89% of its $2.46 billion in assets. The next four, NEOS Enhanced Income 1-3 Month T-Bill ETF (CSHI), Avantis U.S. Quality ETF (AVUQ), Avantis Core Municipal Fixed Income ETF (AVMU) and NEOS Real Estate High Income ETF (IYRI), each lost less than $4 million. Gross outflows across covered active funds totaled $38.6 million.
Chart 4
Largest active ETF inflows and outflows, week to Nov 11
- Above zero
- Below zero
- DYNF+$232.4M
- CGGR+$117M
- AVLV+$90.1M
- CGDV+$73.6M
- QQQI+$70.3M
- IYRI−$1.9M
- AVMU−$2.2M
- AVUQ−$3.8M
- CSHI−$4M
- CGIE−$21.9M
Show as table
| Label | Value ($) |
|---|---|
| DYNF | +$232.4M |
| CGGR | +$117M |
| AVLV | +$90.1M |
| CGDV | +$73.6M |
| QQQI | +$70.3M |
| CGIE | −$21.9M |
| CSHI | −$4M |
| AVUQ | −$3.8M |
| AVMU | −$2.2M |
| IYRI | −$1.9M |
Table 1
Largest active ETF inflows and outflows, week to Nov 11
| Ticker↓ | Fund↕ | Issuer↕ | Category↕ | Net flow↕ | Assets↕ | Flow, % of assets↕ | 4 weeks |
|---|---|---|---|---|---|---|---|
| QQQI | NEOS Nasdaq 100 High Income ETF | NEOS Investments | Dividend & income | ▲+$70.3M | $14.8B | ▲+0.5% | |
| IYRI | NEOS Real Estate High Income ETF | NEOS Investments | Real estate | ▼−$1.9M | $307M | ▼−0.6% | |
| DYNF | BLACKROCK US EQUITY FACTOR ROTATION ETF | iShares (BlackRock) | Factor & style | ▲+$232M | $41.6B | ▲+0.6% | |
| CSHI | NEOS Enhanced Income 1-3 Month T-Bill ETF | NEOS Investments | Treasuries | ▼−$4M | $2.1B | ▼−0.2% | |
| CGIE | Capital Group International Equity ETF | Capital Group | International & emerging | ▼−$21.9M | $2.5B | ▼−0.9% | |
| CGGR | Capital Group Growth ETF | Capital Group | Factor & style | ▲+$117M | $25.7B | ▲+0.5% | |
| CGDV | Capital Group Dividend Value ETF | Capital Group | Dividend & income | ▲+$73.6M | $38.7B | ▲+0.2% | |
| AVUQ | Avantis U.S. Quality ETF | Avantis Investors | Factor & style | ▼−$3.8M | $399M | ▼−1.0% | |
| AVMU | Avantis Core Municipal Fixed Income ETF | Avantis Investors | Municipal bonds | ▼−$2.2M | $171M | ▼−1.3% | |
| AVLV | Avantis U.S. Large Cap Value ETF | Avantis Investors | Factor & style | ▲+$90.1M | $22.9B | ▲+0.4% |
1–10 of 10
Source: Amplify ETFs, Avantis Investors, Capital Group, NEOS Investments, YieldMax ETFs, iShares (BlackRock) published daily NAV and shares outstanding; flow = change in shares outstanding x NAV
Capital Group led but took less than its share of assets
Capital Group's 24 active ETFs took in a net $413.5 million, 41.2% of active gross inflows, below the 47.9% of covered active assets they represent. The firm's funds recorded $0 in each of the three prior weeks, according to its published daily fund data. Its active assets total $164.7 billion.
iShares took 24.3% of active gross inflows against 12.7% of active assets, and NEOS took 13.4% against 10.2%. Avantis took 20.5% against 25.7%, and Amplify 0.7% against 3.0%. YieldMax's 19 funds, with $1.69 billion in assets, recorded no flow. iShares is the only covered issuer with non-zero flows in all four weeks, and its four-week net flow is $1.05 billion. For Capital Group, Avantis and NEOS, the four-week figure equals this week's flow.
Factor and style took $442.5 million, dividend and income $258.8 million
Factor and style was the largest active category, with a net $442.5 million, up from $195.8 million the prior week, according to the issuers' data. Its eight funds include DYNF, CGGR and AVLV. Over four weeks the category has taken $1.19 billion of the $1.82 billion net flow into covered active ETFs, about two-thirds.
Dividend and income took $258.8 million after $0 the prior week, with CGDV, QQQI and SPYI accounting for $209.7 million. QQQI and SPYI are classed as dividend and income based on their names, not as option income. Fourteen option-income funds, with $1.60 billion in assets, recorded no net flow.
International and emerging added $134.0 million, also after $0 the prior week. The "Other" category, which includes CGCV and Capital Group Core Equity ETF (CGUS), took $119.6 million, up from $6.1 million. Three small categories lost money: treasuries (-$4.0 million), real estate (-$1.9 million) and sector and thematic (-$1.1 million).
Chart 6
Active ETF flows by category, week to Nov 11
Categories from fund names by fixed rules
- Above zero
- Below zero
- Factor & style+$442.5M
- Dividend & income+$258.8M
- International & emerging+$134M
- Other+$119.6M
- Broad bonds+$19.1M
- Buffer & defined outcome+$17M
- Small & mid cap+$11.8M
- US large cap & broad market+$11.6M
- Other equity+$8.1M
- Municipal bonds+$4.7M
Show as table
| Label | Value ($) |
|---|---|
| Factor & style | +$442.5M |
| Dividend & income | +$258.8M |
| International & emerging | +$134M |
| Other | +$119.6M |
| Broad bonds | +$19.1M |
| Buffer & defined outcome | +$17M |
| Small & mid cap | +$11.8M |
| US large cap & broad market | +$11.6M |
| Other equity | +$8.1M |
| Municipal bonds | +$4.7M |
Active funds were 19 of 233 ETF launches in eight weeks
Active funds accounted for 19 of the 233 ETF launches in the eight weeks to Nov. 11, about 8%, according to SEC filings and issuer fund data. The busiest active weeks were those of Sept. 30, with 10 launches, and Oct. 14, with seven. No active funds launched in the week to Nov. 11 and one launched the week before.
Chart 7
ETF launches by week, active and other
Eight weeks, by launch date
- Active
- Index and other
Show as table
| Label | Active | Index and other | Total |
|---|---|---|---|
| Sep 23 | 1 launches | 46 launches | 47 launches |
| Sep 30 | 10 launches | 37 launches | 47 launches |
| Oct 7 | 0 launches | 22 launches | 22 launches |
| Oct 14 | 7 launches | 33 launches | 40 launches |
| Oct 21 | 0 launches | 21 launches | 21 launches |
| Oct 28 | 0 launches | 43 launches | 43 launches |
| Nov 4 | 1 launches | 9 launches | 10 launches |
| Nov 11 | 0 launches | 3 launches | 3 launches |
Continue this analysis
Get the complete Private Wealth Daily analysis and every detail that follows.
Enter a valid work email to continue reading.
Already a reader? Sign inThe Morning Brief, every morning. Unsubscribe anytime.
PWD Intelligence
The Active ETF Report
New editions publish on a fixed schedule. Follow the series to see each one on My Desk.
Free. Every morning. Unsubscribe from any edition in one click.